 This article presents a very preliminary empirical analysis of the fatalities unofficially linked to the government’s anti-drug campaign during the period from 30 June to 18 August 2016.
It derives preliminary insights from patterns of media-reported fatalities. Hopefully, it will aid the public to better appreciate the complex landscape of the anti-drug campaign, particularly given the country’s decentralized system of governance. We hope it will also contribute to increased accountability across various police units and local governments, as they seek to suppress drugs while still protecting the rights of all citizens.
Nevertheless, the analysis here is preliminary because of several important caveats.
First, the data is drawn from media reports, yet we cannot ensure that all fatalities linked to the anti drugs campaign have indeed been covered by media. Second, this dataset is unofficial. More careful investigation could sharpen the final list of fatalities, since most are likely pending further investigation. This analysis is not meant to prejudge those outcomes. Third, the information on the context of some of the fatalities is very basic and clearly does not shed full light on the exact nuances of each case. For example, finding a salvage victim in NCR does not necessarily mean that is where the assault took place. Again, this analysis is not meant to prejudge all other possible angles for investigation.
40% of fatalities are not due to police operations.
We begin by classifying the fatalities into three main contexts:
- fatalities linked to police operations;
- fatalities linked to assassins (including hitmen “riding in tandem”); and
- citizens found dead (or “salvage” victims).
Of those fatalities linked to police operations, we further disaggregate according to:
1) fatalities resulting from police buy-bust operations and shootouts;
2) fatalities resulting from serving arrest warrants;
3) fatalities resulting from attempting to escape arrest; and
4) fatalities resulting from serving a search warrant.
Figure 1. Distribution of Fatalities by Context
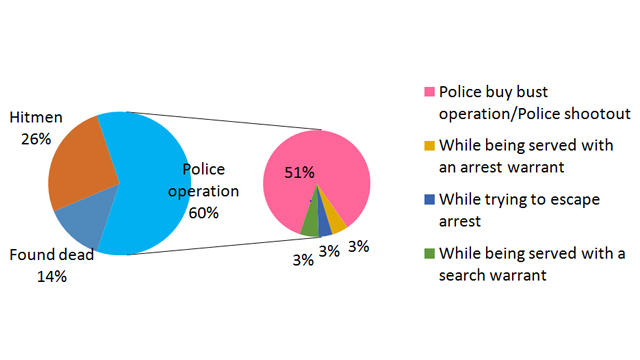
Among the 668 fatalities under analysis, 403 fatalities (60% of the total) were linked to police operations, 175 fatalities (26%) were linked to unknown hitmen or by gunmen “riding in tandem,” 90 fatalities (13%) appeared to be "salvage" (summary execution) victims whose bodies were labeled with tags related to drugs. These figures suggest that a large share of the fatalities – roughly 40% of the total – are not due to police operations (as reported).
Some of the fatalities resulting from police operations are controversial, e.g. those resulting from alleged perpetrators attempting to escape arrest. They are around 3% of the total fatalities.
Table 1. Distribution of Fatalities by Context
| Death Cause | Count | % of Total |
| 1. Found dead | 90 | 13% |
| 2. Unknown hitmen | 175 | 26% |
| 3. Police Operation | 403 | 60% |
| - Police buy bust operation/shootout | 343 | 51% |
| - While being served with an arrest warrant | 20 | 3% |
| - While trying to escape arrest | 17 | 3% |
| - While being served with a search warrant | 23 | 3% |
| Total | 668 | 100% |
Source: ASOG staff calculations based on data from the Philippine Daily Inquirer covering the period | ||
Most fatalities are in Metro Manila and Cebu, but some provinces stand out because of fatalities not linked to police operations.
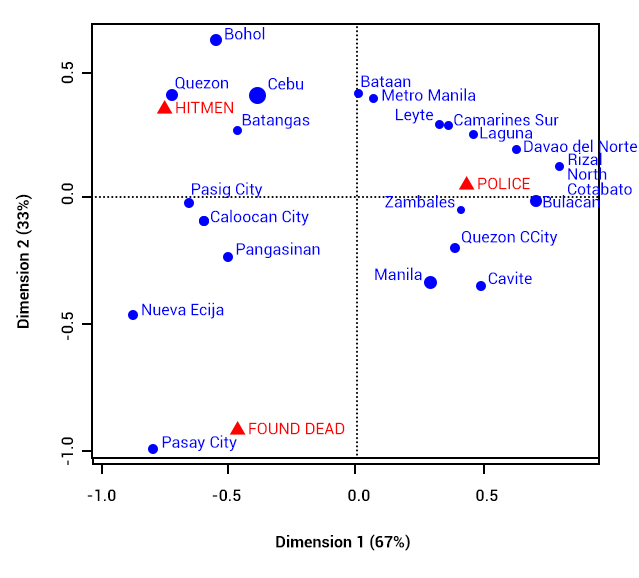
An analysis of the location of the fatalities points to some interesting patterns. We turn to figure 2 which shows the provinces/areas with at least 10 fatalities each; and figure 3 which provides a biplot statistical analysis of which fatality type is most associated with each province/area/city.
The biplot describes the patterns of associations among provinces and the context of the fatality. Provinces near each other in the graph have similar profiles. A province is associated to a particular context if it is plotted nearby the point represented by a specific context. (To say that two points are near each other, you have to draw lines from the center to the points of interest. If the angle formed is acute angle, they are associated, if it’s right angle – no association. The farther the two points from the center are, given that they are near each other, the stronger their association is.) Larger size of points in the graph means higher frequency (e.g. among the causes, highest count of fatality can be attributed to police operations).
Several additional patterns emerge.
First, Metro Manila has the highest number of fatalities, followed by Cebu, Bulacan, Quezon, and Pangasinan.
In addition, Bulacan, Zambales and parts of Metro Manila stand out due to the number of fatalities linked to police operations. On the other hand, Batangas, Cebu and Quezon stand out due to the high number of fatalities linked to hitmen. Finally, Pasay City stands out in terms of salvage victims.
Figure 2. Provinces with at least 10 Fatalities
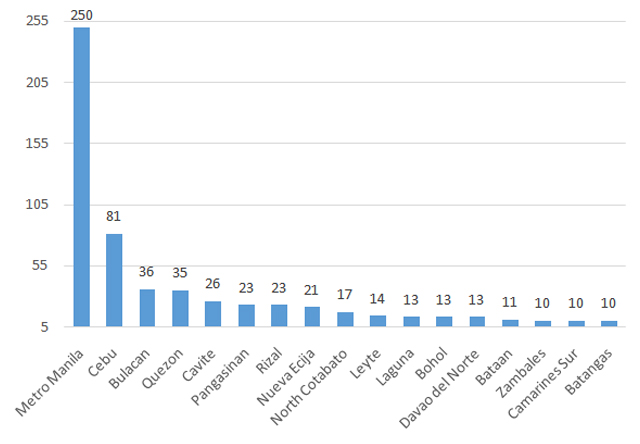
Figure 3. Biplot of Patterns Associated with the Fatalities Across Provinces/Areas/Cities
In Metro Manila, most of the fatalities are in the Manila Police District
Figures 4 and 5 focus on the fatalities in Metro Manila, which accounts for almost 40% of the total fatalities under analysis. The cities of Manila, Quezon, and Pasay are the locations linked to the majority of the fatalities in Metro Manila. Figure 5 more specifically identifies the police jurisdictions where the fatalities are associated.
Figure 4. Distribution of Fatalities in Metro Manila by City
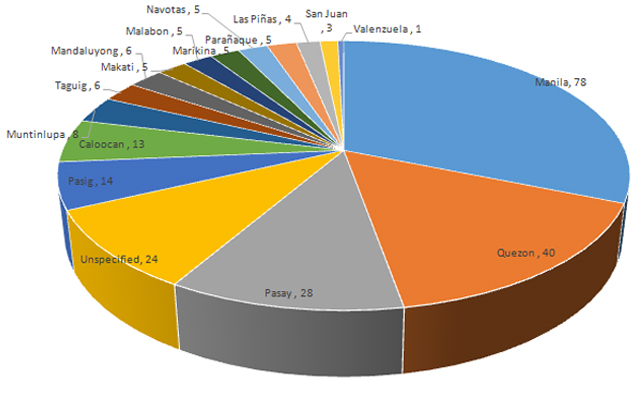
Figure 5. Distribution of Fatalities in Metro Manila by Police District
(Figures in terms of actual value and percentage)
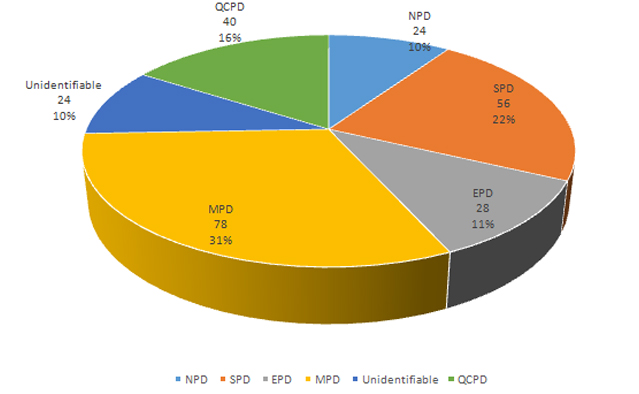
Table 2. Disaggregation of Fatalities by Type and Police District in Metro Manila
| Police District | Found dead | Hitmen | Police operation | Total |
| EPD | 10 | 10 | 8 | 28 |
| MPD | 16 | 6 | 56 | 78 |
| NPD | 4 | 12 | 8 | 24 |
| QCPD | 6 | 3 | 31 | 40 |
| SPD | 23 | 15 | 18 | 56 |
| Unidentifiable | 0 | 8 | 16 | 24 |
| Total | 59 | 54 | 137 | 250 |
Source: ASOG staff calculations based on data from the Philippine Daily Inquirer. | ||||
Fatalities due to police operations and shootouts are most prevalent in Manila and Quezon City Police districts. A large number of the "salvage" victims were found in Southern police district (SPD) (e.g. covering Las Pinas, Makati, Muntinlupa, Paranaque, Pasay and Taguig) and Manila police district (MPD). Victims of unknown hitmen are scattered across the different police districts. – Rappler.com
The views expressed in this article are the authors’ and do not necessarily reflect those of the Ateneo de Manila University. Ronald U Mendoza is the Dean of the Ateneo School of Government (ASOG); and Miann Banaag is a statistician with ASOG.